Unit 4: Statistics & Test Construction (cont.)

Scatterplot: A graphed cluster of dots, each which represents the values of two variables.  The slope of the dots represents the direction (+ or -) of the relationship while the amount of "scatter" suggests the strength of the correlation.
     Correlation Coefficient (r): A statistical measure of the extent to which two factors vary together, and thus how well either factor predicts the other. The statistic, r,  is always between -1.00 and +1.00.
A Positive correlation coefficient means that as one variable increases, so does the other.
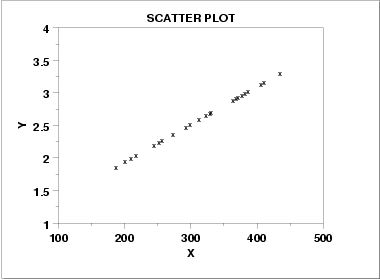
scatter plot showing exact linear relationship
A Negative correlation coefficient means that as one variable increases, the other decreases (i.e., an inverse relationship).
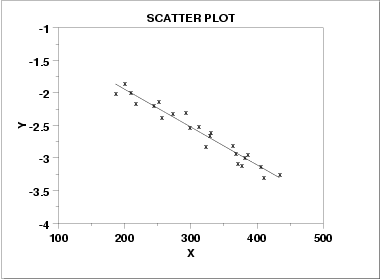
scatter plot showing strong negative correlation
Regression to the Mean: The tendency for extreme or unusual scores to fall back (regress) toward their average.

Statistical Significance: Probability that the results obtained were due to chance (represented by the value of 'p').

In psychology, it is standard that a p-value of .05 or less means that results were statistically significant (i.e., not due to chance).

t-test: A statistical procedure designed to test the difference between the means of two groups

                          Test Construction
Reliability
:
Ability of a test to produce consistent and stable scores. Test-retest Reliability: give the same test to the same group of subjects twice and correlate the results.
Validity: Ability of a test to actually measure what it has been designed to measure.
     Face Validity: Do the questions "appear" to measure the construct of interest.
     Content Validity: Does the test adequately sample the skills or knowledge that it is supposed to measure.
     Predictive Validity: The success with which a test  predicts the behavior it is designed to predict.  This is assessed by computing the correlation between the test scores (e.g., SAT scores) and the criterion (e.g., college GPA).
      Criterion: The behavior that a test is designed to predict.
      Restricted Range: A narrow range of scores (such as only very high GRE score for graduate school admission) reduces the predictive validity of the test.
Standardization: Giving individual scores meaning by comparing them with the performance of a pretested group (e.g., give the test to a large representative sample of subjects and determine the mean and standard deviation.  Now, you know if individual score are high, low, or average).

See handout on the Normal Curve


[Home]        [SYLLABUS]        [CALENDAR]       [STUDY GUIDES]       [REVIEWS]     [LINKS]  [HOMEWORK]     [HANDOUTS]           [UNIT CONTENTS]            [RESEARCH]